
Genero Observability gives you the inside-the-server view of your Genero applications — which functions ran, which SQL fired, and where the time went — as OpenTelemetry traces in your existing observability stack.
Full visibility without touching your application. It’s enabled by configuration, not code — no runtime change, no 4GL source change.
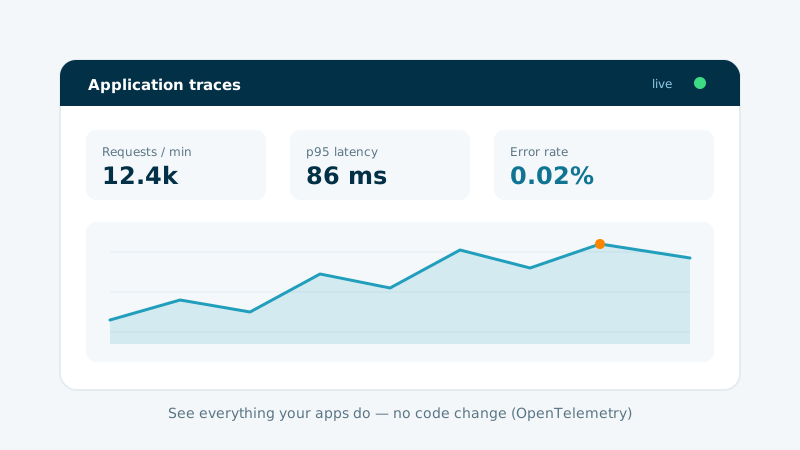
Your app, as traces — in the APM you already run
Native diagnostics in, OpenTelemetry traces out — one trace per user interaction.
Your Genero app runs unchanged
No runtime change, no 4GL source change — it’s enabled by configuration, not code.
Its native diagnostics become traces
Genero’s own function and SQL diagnostics are turned into OpenTelemetry (OTLP) spans.
Traces land in your APM
Exported to the tools you already use — one trace per user interaction.
Enabled by configuration alongside your existing Genero stack — your application code is never touched.
Works with your stack
Vendor-neutral OTLP — point it at any OTLP/HTTP receiver:
- Datadog
- Grafana Tempo
- Jaeger
- OpenTelemetry Collector
From a slow report to the exact line that caused it
Every user interaction becomes a trace you can read at a glance.
Per-interaction flame graphs — One trace per user action — see the whole call, end to end.
Function-level timing — Which functions ran, and how long each one took.
SQL visibility — Which SQL statements fired, and their execution time.
Where the time goes — Pinpoint the slow interactions before your users feel them.
Why it matters
Cut mean-time-to-resolve on production incidents, and catch performance regressions before your customers do. All on the systems you already run — without a code change.
Get eyes inside your Genero applications.
See exactly how your critical systems perform — in the observability stack you already use, without a code change.
Talk to an expertFrequently asked questions
Do I have to change my application code?
No. Genero Observability is enabled by configuration, not code — no runtime change and no 4GL source change.
Which APMs are supported?
Datadog, Grafana Tempo, Jaeger — or any OTLP/HTTP receiver. It’s vendor-neutral OpenTelemetry, so you point it at the stack you already run.
What does a trace show?
A per-interaction flame graph: which functions ran, which SQL statements fired, and where the time went — for each user action.
Does it change my runtime?
No. There’s no runtime change and no 4GL source change — it’s enabled by configuration and exports your existing diagnostics as OpenTelemetry traces to the APM you already run.
Is this an AI feature?
No. Genero Observability watches how your applications execute — it’s pure monitoring, separate from Genero Intelligence and Genero Arc’s AI-agent access.